Friday 31 July 2020

powershell 8 logic

PS C:\Users\bob\ps> $path = 'c:\users'
if (Test-Path $path) {
    write-host "$path verified"
}
else {
    write-host "$path not verified"
}
c:\users verified

PS C:\Users\bob\ps> [int]$value = Read-Host 'Enter a number'
switch ($value) {
    1 {
        Write-Host 'You entered the number one'
     }
     2 {
        Write-Host 'You entered the number two'
     }
     3 {
        Write-Host 'You entered the number three'
     }
     4 {
        Write-Host 'You entered the number four'
     }
     5 {
        Write-Host 'You entered the number five'
     }
    Default {
        Write-Host "I don't know what to do with $value"
    }
}
Enter a number: 3
You entered the number three

PS C:\Users\bob\ps> for($i = 0; $i -le 15; $i++){
    Write-Host -NoNewline $i ' ' -ForegroundColor $i
}


$path ='C:\Users\bob\Desktop\7.30'
[int]$totalSize = 0
$fileInfo = Get-ChildItem $path -Recurse
foreach($file in $fileInfo){
    $totalSize += $file.Length
}
Write-Host "Total size of file in $path is $($totalSize/1Mb) MB"
Total size of file in C:\Users\bob\Desktop\7.30 is 374.533009529114 MB

PS C:\Users\bob\ps> $pathVerified = $false
do{
    $path = Read-Host 'please enter a file path to evalute'
    if(Test-Path $path){
        $pathVerified = $true
    }
}while (!$pathVerified)
please enter a file path to evalute: c:\user
please enter a file path to evalute: c:\users

PS C:\Users\bob\ps> $pathVerified = $false
while (!$pathVerified) {
    $path = Read-Host 'please enter a file path to evalute'
    if(Test-Path $path){
        $pathVerified = $true
    }
}
please enter a file path to evalute: c:\user
please enter a file path to evalute: c:\users

PS C:\Users\bob\ps> $path = 'c:\users\bob'
$folderCount = 0
Get-ChildItem $path | ForEach-Object -Process {if ($_.PSIsContainer) {$folderCount++}}
$folderCount
65

reference:
https://www.youtube.com/watch?v=nesN4Iznbco

中国三峡

July 30 trip


windows 10 video editor
https://www.windowscentral.com/how-start-using-photos-video-editor-windows-10

Wednesday 29 July 2020

powershell 7 variable 2

$process = Get-Process
$process | where-object {$_.cpu -gt 100}

$process = Get-Process
$process | Sort-Object WorkingSet64 -Descending

$total = $true

PS C:\Users\bob\ps> [int]$num1 = '2'
[int]$num2 = '3'
$num1+$num2
5

$total.tostring()

PS C:\Users\bob\ps> $var1 = 'two plus one equals: $(1 + 2)'
$var1
two plus one equals: $(1 + 2)

PS C:\Users\bob\ps> $var2 = "two plus one equals: $(1 + 2)"
$var2
two plus one equals: 3

Get-Variable

Get-ChildItem env:

$env:COMPUTERNAME

PS C:\Users\bob\ps> $path = Read-Host -Prompt 'please enter the file path to scan for large files'   
please enter the file path to scan for large files: C:\Users\bob\ionic-react-here\build

PS C:\Users\bob\ps> $rawFileData = Get-ChildItem -Path $path -Recurse
$largeFiles = $rawFileData | Where-Object {$_.Length -gt 0.1MB}
$largeFilesCount = $largeFiles | Measure-Object | Select-Object -ExpandProperty Count
Write-Host "There are $largeFilesCount large files(s) in $path"
There are 8 large files(s) in C:\Users\bob\ionic-react-here\build

reference:
https://www.youtube.com/watch?v=4Rc0aEMXiWw

Tuesday 28 July 2020

Street Food in Italy


powershell 7 vscode

install vscode extension

create text.ps1 -> write command -> ctral + A -> F8 to execute all commands

get-module psscriptanalyzer
install analyzer to show hinst for error

bottom right corner click powershell to switch to other language

reference:

Monday 27 July 2020

powershell 6

PS C:\Users\chuanshuo> $PSVersionTable

Name                           Value
----                           -----
CLRVersion                     2.0.50727.8793
BuildVersion                   6.1.7601.17514
PSVersion                      2.0
WSManStackVersion              2.0
PSCompatibleVersions           {1.0, 2.0}
SerializationVersion           1.1.0.1
PSRemotingProtocolVersion      2.1

update powershell
https://www.microsoft.com/en-us/download/details.aspx?id=54616

install nuget
run as admin
PS C:\Windows\system32> [Net.ServicePointManager]::SecurityProtocol = [Net.SecurityProtocolType]::Tls12
PS C:\Windows\system32> Install-PackageProvider -Name NuGet -MinimumVersion 2.8.5.201 -Force
https://answers.microsoft.com/en-us/windows/forum/windows_7-performance/trying-to-install-program-using-powershell-and/4c3ac2b2-ebd4-4b2a-a673-e283827da143
https://blog.velingeorgiev.com/install-powershell-5-nuget-sharepointpnppowershellonline-behind-proxy

PS C:\Users\chuanshuo\Downloads\Win7AndW2K8R2-KB3191566-x64> $PSVersionTable

Name                           Value
----                           -----
PSVersion                      5.1.14409.1005
PSEdition                      Desktop
PSCompatibleVersions           {1.0, 2.0, 3.0, 4.0...}
BuildVersion                   10.0.14409.1005
CLRVersion                     4.0.30319.42000
WSManStackVersion              3.0
PSRemotingProtocolVersion      2.3
SerializationVersion           1.1.0.1

reference:
https://www.youtube.com/watch?v=a2qzz_WM9Dg&t=627s

night is for sleep, day is for rest

Sunday 26 July 2020

北美卡车司机 - Trucker 刚


Food in Florida

powershell 5

PS C:\Users\bob> get-help stop-process -Examples

get-random

get-itemproperty NTUSER.DAT | format-list *

PS C:\Users\bob> find-module -Tag Telegram

Version    Name                                Repository           Description
-------    ----                                ----------           -----------
1.12.0     PoshGram                            PSGallery            PoshGram provides functionality to send various ...

get-process | sort-object id

get-process notepad++ | stop-process

get-service

PS C:\Users\bob> 1,2,3 | foreach-object {$_}
1
2
3

get-process | select-object name,id,cpu

PS C:\Users\bob> get-process | where-object {$_.cpu -gt 50}

Handles  NPM(K)    PM(K)      WS(K)     CPU(s)     Id  SI ProcessName
-------  ------    -----      -----     ------     --  -- -----------
    293      18     6916       8924      76.50   6488  14 chrome
    324      27   148200     197684      80.23   6868  14 chrome
   1515      47   326308     160516   2,692.55   7512  14 chrome
    432      22    23992      30612     481.83   7724  14 chrome
   1513      65   283372     283576     454.69   7760  14 chrome
   3252     180    97884      97396      88.55  12240  14 explorer
    957      75    32656      23648     152.98   5780  14 YoudaoDict

get-childitem -path $home -recurse | where-object {$_.length -gt 20mb}
look for files in home and sub directories that is bigger than 20mb

get-childitem -path $home -recurse | where-object {$_.length -gt 20mb} | measure-object
count # of files

get-process | stop-process -whatif
find out which process will be stopped

reference:
https://www.youtube.com/watch?v=QKmyf6c83Rs

banff, lake louise, waterton, stampede


Saturday 25 July 2020

金银天生非货币,货币天然是金银。

powershell 4 variable

PS C:\Users\bob> $var = 10.2
PS C:\Users\bob> $var.gettype()

IsPublic IsSerial Name                                     BaseType
-------- -------- ----                                     --------
True     True     Double                                   System.ValueType

get-process

PS C:\Users\bob> get-typedata *ip*

TypeName                          Members
--------                          -------
Deserialized.System.Net.IPAddress {}
System.Net.IPAddress              {[IPAddressToString, System.Management.Automation.Runspaces.ScriptPropertyData]}

PS C:\Users\bob> [ipaddress]'10.0.0.1'

Address            : 16777226
AddressFamily      : InterNetwork
ScopeId            :
IsIPv6Multicast    : False
IsIPv6LinkLocal    : False
IsIPv6SiteLocal    : False
IsIPv6Teredo       : False
IsIPv4MappedToIPv6 : False
IPAddressToString  : 10.0.0.1

PS C:\Users\bob> [ipaddress]'256.0.0.1'
Cannot convert value "256.0.0.1" to type "System.Net.IPAddress". Error: "An invalid IP address was specified."
At line:1 char:1
+ [ipaddress]'256.0.0.1'
+ ~~~~~~~~~~~~~~~~~~~~~~
    + CategoryInfo          : InvalidArgument: (:) [], RuntimeException
    + FullyQualifiedErrorId : InvalidCastParseTargetInvocation

PS C:\Users\bob> get-typedata *mail*

TypeName                                 Members
--------                                 -------
Deserialized.System.Net.Mail.MailAddress {}
System.Net.Mail.MailAddress              {}


PS C:\Users\bob> [mailaddress]'bob@gmail.com'

DisplayName User Host      Address
----------- ---- ----      -------
            bob  gmail.com bob@gmail.com

PS C:\Users\bob> [mailaddress]'bobgmail.com'
Cannot convert value "bobgmail.com" to type "System.Net.Mail.MailAddress". Error: "The specified string is not in the
form required for an e-mail address."
At line:1 char:1
+ [mailaddress]'bobgmail.com'
+ ~~~~~~~~~~~~~~~~~~~~~~~~~~~
    + CategoryInfo          : InvalidArgument: (:) [], RuntimeException
    + FullyQualifiedErrorId : InvalidCastConstructorException

PS C:\Users\bob> get-psdrive

Name           Used (GB)     Free (GB) Provider      Root                                               CurrentLocation
----           ---------     --------- --------      ----                                               ---------------
Alias                                  Alias
C                 228.46        701.70 FileSystem    C:\                                                      Users\bob
Cert                                   Certificate   \
Env                                    Environment
Function                               Function
HKCU                                   Registry      HKEY_CURRENT_USER
HKLM                                   Registry      HKEY_LOCAL_MACHINE
Variable                               Variable
WSMan                                  WSMan

PS C:\Users\bob> cd variable:
PS Variable:\> get-childitem
display all existing variable

PS Variable:\> cd Env:
PS Env:\> ls
display all environment variable

PS Env:\> $env:windir
C:\WINDOWS

ls | select -last 1 | fl *
ls | select -last 1 | select *
ls | select -last 1 | get-members

PlayStation 5 Preview

powershell 3 run profile

PS C:\Users\bob> $profile | select *


AllUsersAllHosts       : C:\Windows\System32\WindowsPowerShell\v1.0\profile.ps1
AllUsersCurrentHost    : C:\Windows\System32\WindowsPowerShell\v1.0\Microsoft.PowerShell_profile.ps1
CurrentUserAllHosts    : C:\Users\bob\Documents\WindowsPowerShell\profile.ps1
CurrentUserCurrentHost : C:\Users\bob\Documents\WindowsPowerShell\Microsoft.PowerShell_profile.ps1
Length                 : 73

new-item -itemtype directory newfolder
create new folder = mkdir = md
rmdir remove directory

set-executionpolicy remotesigned
run as administrator

PS C:\WINDOWS\system32> get-executionpolicy -list

        Scope ExecutionPolicy
        ----- ---------------
MachinePolicy       Undefined
   UserPolicy       Undefined
      Process       Undefined
  CurrentUser    RemoteSigned
 LocalMachine    RemoteSigned

md C:\Users\bob\Documents\WindowsPowerShell

notepad $profile
create Microsoft.PowerShell_profile.ps1 in C:\Users\bob\Documents\WindowsPowerShell

type get-date in created ps1 file, save, close powershell, reopen

script get-date in profile is executed.

reference:

Friday 24 July 2020

powershell 2

get-childitem | Format-list *

PSPath            : Microsoft.PowerShell.Core\FileSystem::C:\Users\bob\Untitled1.ipynb
PSParentPath      : Microsoft.PowerShell.Core\FileSystem::C:\Users\bob
PSChildName       : Untitled1.ipynb
PSDrive           : C
PSProvider        : Microsoft.PowerShell.Core\FileSystem
PSIsContainer     : False
Mode              : -a----
VersionInfo       : File:             C:\Users\bob\Untitled1.ipynb
                    InternalName:
                    OriginalFilename:
                    FileVersion:
                    FileDescription:
                    Product:
                    ProductVersion:
                    Debug:            False
                    Patched:          False
                    PreRelease:       False
                    PrivateBuild:     False
                    SpecialBuild:     False
                    Language:

BaseName          : Untitled1
Target            : {}
LinkType          :
Name              : Untitled1.ipynb
Length            : 555
DirectoryName     : C:\Users\bob
Directory         : C:\Users\bob
IsReadOnly        : False
Exists            : True
FullName          : C:\Users\bob\Untitled1.ipynb
Extension         : .ipynb
CreationTime      : 2020-07-13 9:41:01 PM
CreationTimeUtc   : 2020-07-14 3:41:01 AM
LastAccessTime    : 2020-07-24 8:31:23 PM
LastAccessTimeUtc : 2020-07-25 2:31:23 AM
LastWriteTime     : 2020-07-13 9:43:04 PM
LastWriteTimeUtc  : 2020-07-14 3:43:04 AM
Attributes        : Archive

get-childitem > directory.txt
write directory table to txt

notepad.exe .\directory.txt
open txt

copy-item .\directory.txt ..
copy txt to parent directory

move-item
remove-item

reference:
https://www.youtube.com/watch?v=vO0P3JuItcM

Thursday 23 July 2020

powershell 1

get-alias

get-childitem | select-object name
show file names in folder

get-childitem | select-object -first 2
show first 2 files in folder

get-childitem | select-object -last 2

 get-childitem | select-object -index 2
select 3rd file in folder

get-childitem | select-object -index 2 | select-object name

get-childitem | select-object -index 2 | get-member
show property info

(get-childitem | select -first 2).name

get-help select

get-help select -full

get-help *printer*

get-command *printer*

reference:
https://www.youtube.com/watch?v=TUNNmVeyjW0

在多伦多过上中产生活所需年收入?


在多伦多生活什么都贵,房子贵,车保贵,现在超市食品也涨价了...很多人声称自己是中产,但在多伦多,过上真正的中产生活要多少年收入?最近的一项研究把人吓一跳:就是单身人士,也要六位数才行!

据Narcity报道,主持这项研究的Fong and Partners的Victor Fong表示,按照他们的标准计算,如果加上生活各方面的开支,无孩的普通单身人士的年总收入需要达到$135,000,在多伦多才能算得上是中产阶级。


首先住是最重要,也是最花钱的一项。如果有这笔年收入,将使您能够养得起多伦多一套拥有土地所有权的镇屋,如上图所示。

而根据Fong的报告,类似这样的房产,2020年6月的平均价格为$1,042,806元。

Victor Fong对Narcity表示,实际上,一名单身人士需要税后收入$91,844才能在多伦多维持其中产阶级的生活方式。

房子的大致支出定下来之后,其它的开支就比较好算了,费用明细如下:


显而易见,养房子的开支是大头,这个几乎每位多伦多居民都有体会,不然就不会对利率涨落太上心了。

其它开支不同人士也许大同小异。但对于度假游玩一项,可能差异就大了。既然是中产,就应该有中产的生活范,显然度假一项必不可少。

根据Fong的报告,每年度假的预算就高达$5,000元,接近每年物业税,或公用事业费的支出,甚至超过每年在超市购物的所有花销。

这就是中产!玩的钱比吃喝的钱还多!

此外还有一个支出大项,虽然这个也是因人而异的,但实际上每个人都在做:为退休之后积攒一点钱。既然是中产,年轻时候过得比较逍遥,退休之后也不能太寒酸,不说优裕,也应该无忧吧,因此要为未来多存一点。

根据Fong的报告,中产单身每年要为退休之后的开销存下$10,322元,以确保老来生活无忧。

该报告在其摘录中发出了“今不如昔”的感慨,称“这种中产生活方式其实在30年之前很普遍,很多人都如此。如今,这种生活方式恐怕仅适用于人群中居于收入顶端10%的人士了。”

其中一个很大原因,也许与房价有关。远的不说,就说2019年,多伦多的房价飞涨:房屋平均价格上涨8%,达到$720,000元。 这比上一年整整增加了$55,000。

而相比之下,多伦多普通家庭的税后收入中位数则只有$58,264元。

tracert, nslookup, netstat

Sunday 19 July 2020

Somewhere Over the Rainbow


Machine Learning with Python note 2

array1 = np.array(list1)
array2 = np.array(list2)
array3 = array1/array2

np.arrange(10)
generate array 0 - 9

np.arrange(5, 56, 10)
generate array begin with 5, increment step by 10, end at 56, exclude 56

np.linspace(10, 100, 5)
generate array with 5 elements from 10 to 100, equal space

array1.reshape(8, 3)
convert array1 into 8 rows x 3 columns matrix

result = array2.reshape(2,2,6)
result has 2 rows, each row has 2 columns, each column has 6 elements

array3[array3 % 2 == 0]
filter array3, return even number

np.zeros(50)
create array with 50 0

np.zeros((3, 5)) + 6
create 3 x 5 matrix with all values 6

np.ones((5, 9))
creatre 5 x 9 matrix with all values 1

np.eye(5)
identity matrix
1,0,0,0,0
0,1,0,0,0
0,0,1,0,0
0,0,0,1,0
0,0,0,0,1

np.eye(5,6)
1,0,0,0,0,0
0,1,0,0,0,0
0,0,1,0,0,0
0,0,0,1,0,0
0,0,0,0,1,0

import seaborn as sns
sns.distplot(pd['col'], kde=True)
analyze the spread of col, histogram

plot = sns.countplot(x = 'col', data = pd)
plot.set_xticklabes(plot.get_xticklabels(), rotation = 45)
bar plot rotate xlabels 45

sns.regplot(x = 'col1', y = 'col2', data = pd)
scatter plot, then fit a line

pd['col'].quantile([0.5, 0.7, 0.9])
find col median value, values at 70% and 90%

new_frame = pd.loc[pd['col1'] < pd['col1'].quantile(0.95)]
filter frame ingnore top 5% in col1

find_cols = [cols for cols in pd.columns if 'abc' is in cols]
find columns that contains abc in name

fig, axs = plt.subplots(nrows = 3, ncols = 3, figsize = (10, 10))
for i in range(0, 9):
   rows = i // 3
   cols = i % 3
   ax = axs[rows, cols]
   plot = sns.regplot(x = pd.columns[i], y = 'col2', data = pd, ax = ax)
create 3 x 3 subplots showing scatter plot for first 9 columns with relation to col2

plot = sns.boxplot(x = 'col1', y = 'col2', data = pd)
box plot shows median and range that most of data reside

pd.describe(include='all')
shows mean, std, min, max, 25%...

pd.info()
shows column data types

import matplotlib.pyplot as plt
%matplotlib inline
pd.hist(figsize=(20,30))
histogram

pd.pivot_table(pd, index=['col1', 'col2'], columns=['col3'], aggfunc=len)
pivot table

sns.pairplot(pd)
scatter plot of 2 columns in pd, hist plot if 2 columns are same

Saturday 18 July 2020

land buying due diligence checklist


  1. who owns a property
  2. back tax and tax liens
  3. property zoning
  4. access property
  5. utilities
  6. slopes and elevation


find land for sale


compass land USA
https://www.youtube.com/channel/UCAv4howPVInjQapHAOr6wxA/videos

Thursday 16 July 2020

疫情下,加拿大失业率

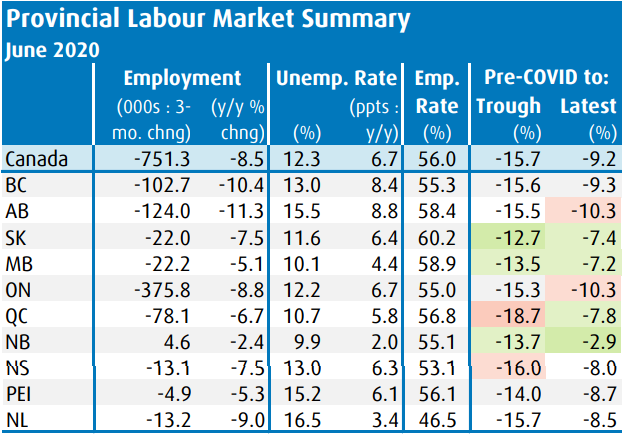
根据最新一期的BMO劳动力市场报告,大西洋省份的劳动力市场表现尤其出色,而COVID-19导致的失业率上升在加拿大主要城市中最高。
数字显示,加拿大现在已经追回了因疫情流行而失去的41%的工作。加拿大目前的失业率在6月份为12.3%,比去年同期上升了6.7%。
image.png
新不伦瑞克省(NB)表现最好,失业率自去年以来仅增长2%,至9.9%。它是目前失业率低于10%的唯一省。
艾伯塔省对石油的依赖加剧了疫情造成的经济困难,该省的就业率仍比疫情前低10.3%。
BC省6月份的失业率为13%,比疫情前的水平上升了8.4个百分点。
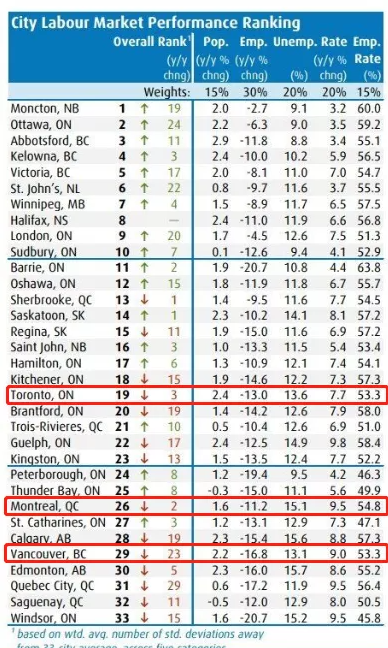
冠状病毒大流行给加拿大主要城市的劳动力市场造成了最严重的打击。
多伦多、蒙特利尔、温哥华一向被认为是最容易找工作的地方,但在新冠病毒大流行的环境下,这3个城市变成了最难找工作的地方。
image.png
多伦多失去了13%的工作,失业率为13.6%,在33个城市中排名第19。
蒙特利尔的情况更糟,排名第26位,失业率达15.1%。
温哥华排名第29位,失去了几乎所有工作的17%。
排名第一的蒙克顿市是新不伦瑞克省三个最大的城市中心之一,仅失去了一年前的2.7%的工作,失业率为9.1%,远低于全国平均水平12.3%。
原因是什么?
与其它地方相比,加拿大大西洋省份受到新冠病毒的打击较小,在某些情况下,居家令也比较松。
以新不伦瑞克省为例,尽管该地区依赖旅游业,疫情中旅游业已经几乎停顿了,但该地区的许多其它关键产业(如食品加工和渔业)因为是必需行业,一直在继续运转。
当然,疫情下的这种特殊经济情况会持续多久,还是未知数。虽然联邦的各项救济措施,在给经济注入资金,但联邦的财政赤字正以爆炸性的速度增长,加拿大的经济到今年年底可能会出现很大变化。
但不管接下来发生什么事情,至少现在应该向大西洋省份致敬,它们在这次的经济动荡中赢得了第一场胜利。

Monday 13 July 2020

Machine Learning with Python note

df.loc[['row_name1', 'row_name2'], ['col1', 'col2', 'col3']]
return data frame 2 x 3

df[:, 'col']
return series

df[:, ['col']]
return data frame Rn x 1

df[['col']]
same as previous

df.loc[df['col1']>10, ['col1', 'col2']]
filtering rows with col1 > 10, show col1 and col2

df.loc[df['col1'].isin['condition1', 'condition2']]

df1.reset_index(inplace=True, drop=true)
after filtering, drop old index, create new index

df.sort_values(by=['col1', 'col2'], ascending=[True, False])
sort by col1 ascending, col2 descending

df['new_col'] = np.where(df['col1'>10, 'long', 'short')
create new col if col1 > 10, write value long, else short

df['new_col'] = np.array(2000)
create a new col and fill with 2000

df.groupby('col1')['col2'].agg('mean')
group data by col1, calculate mean of col2
same as df.groupby('col1')['col2'].mean()

df.groupby(['col1', 'col2']).agg(['mean', 'sum'])
group data by col1, then group each row by col2 (nesting). calculate mean and sum for each row

df.groupby('col1').agg({'col2': ['mean'], 'col3': ['min', 'max']})
group data by col1, create new column calculating mean of col2, create 2 more column calculating min and max of col3

[x*4 for x in list]

pd.apply('mean')
calculate mean for each column of pd

pd.select_dtypes(include = ['int64', 'float64']).apply('mean', axis = 1)
calculate mean for each row of pd, ignore none number values

import numpy as np
def bonus_func(col):
   bonus = np.where(col > 10, True, False)
   return bonus
sales['Jan_bonus'] = bonus_func(sales['Jan'])
sales
add a column to sales showing if bonus condition is meet (Jan sales > 10) for each row

bonus_frame = sales.select_dtype(include = ['int64', 'float64']).apply(bonus_func)
calculate bonus condition for each column

pd.concat([sales, bonus_frame]), axis = 1)
append bonus frame to sales

df.dropna()
drop rows with N/A

df.dropna(inplace = True)
drop rows in original frame

df.dropna(axis = 1)
drop columns with N/A

df.dropna(threshold = 2)
drop rows with 2 or more N/A

df.fillna(0)
fill N/A with 0

Saturday 11 July 2020

ionic react Here cost of living

purchase power index shows US and EU has most purchase power

zoom in and press mark to get index value

living cost index shows New York, central Europe, and England cost a lot

rent index shows New York, LA, and Hong Kong are very expensive to rent

groceries index shows food price in south Korea and central Europe are high

//Here1.js

import React, { useState, useEffect } from 'react';
import PageForm from './PageForm'
import JSSoup from 'jssoup'
import axios from 'axios'
import data from './data'

export default function Here() {
    const [map, setMap] = useState(null)
    const [layer, setLayer] = useState(null)
    const [loadData, setLoadData] = useState(false)

    useEffect(async () => {
        //await getData()
        //console.log(data.Cost_of_Living)

        getMap()
        setTimeout(async () => {
            await setLoadData(true)
            document.getElementById('refreshButton').click()
        }, 1000);
        return () => map.dispose();
    }, []);

    const H = window.H;

    const platform = new H.service.Platform({
        apikey: "JNIn_O9OQdca51JT5ofoou0WOKdp69bNG-XxHaHqPLo"
    });

    const defaultLayers = platform.createDefaultLayers();

    const getMap = () => {
        // Create an instance of the map
        const map = new H.Map(
            document.getElementById('mapView'),
            layer ? layer : defaultLayers.raster.normal.map,
            {
                // This map is centered over Europe
                zoom: 2.5,
                center: { lat: 51.048615, lng: -114.070847 },
                pixelRatio: window.devicePixelRatio || 1
            }
        );

        // add a resize listener to make sure that the map occupies the whole container
        window.addEventListener('resize', () => map.getViewPort().resize());

        // Behavior implements default interactions for pan/zoom (also on mobile touch environments)
        var behavior = new H.mapevents.Behavior(new H.mapevents.MapEvents(map));

        // create default UI with layers provided by the platform
        var ui = H.ui.UI.createDefault(map, defaultLayers);

        function addMarkerToGroup(group, coordinate, info) {
            const colors = ['#0000FF', '#0080FF', '#00FFFF', '#80FF00', '#FFFF00', '#FF8000', '#FF0000']
            const level = Math.ceil((parseFloat(info) - 2.25) / 24.21)
            //add a marker with number on left
            const svgMarkup = '<svg width="24" height="24" ' +
                'xmlns="http://www.w3.org/2000/svg">' +
                '<path style="fill:' + colors[level] +
                ';" d="M16.5 24.447v-0.996c3.352 0.099 5.993 1.174 5.993 2.487 0 1.379-2.906 2.56-6.492 2.56s-6.492-1.181-6.492-2.56c0-1.313 2.641-2.389 5.992-2.487v0.996c-2.799 0.069-4.993 0.71-4.993 1.491 0 0.827 2.459 1.623 5.493 1.623 3.033 0 5.492-0.796 5.492-1.623-0.001-0.781-2.194-1.421-4.993-1.491zM10.516 8.995c0-3.033 2.521-5.493 5.556-5.493 3.034 0 5.493 2.46 5.493 5.493 0 2.607-1.818 4.786-4.256 5.348l-1.309 13.219-1.313-13.256c-2.362-0.615-4.171-2.756-4.171-5.311zM16 7.524c0-0.828-0.671-1.498-1.498-1.498s-1.499 0.67-1.499 1.498c0 0.827 0.671 1.498 1.499 1.498s1.498-0.67 1.498-1.498z"></path>' +
                '<text x="6" y="18" font-size="12pt" font-family="Arial" font-weight="bold" ' +
                'text-anchor="middle" fill="black">${markerText}</text>' +
                '</svg>';

            const icon = new H.map.Icon(svgMarkup.replace('${markerText}', ''))
            const marker = new H.map.Marker(coordinate, { icon: icon })
            // add custom data to the marker
            marker.setData(info);
            group.addObject(marker);
        }


        /**
         * Add two markers showing the position of Liverpool and Manchester City football clubs.
         * Clicking on a marker opens an infobubble which holds HTML content related to the marker.
         * @param  {H.Map} map      A HERE Map instance within the application
         */
        function addInfoBubble(map) {
            var group = new H.map.Group();

            map.addObject(group);

            // add 'tap' event listener, that opens info bubble, to the group
            group.addEventListener('tap', function (evt) {
                // event target is the marker itself, group is a parent event target
                // for all objects that it contains
                var bubble = new H.ui.InfoBubble(evt.target.getGeometry(), {
                    // read custom data
                    content: evt.target.getData()
                });
                // show info bubble
                ui.addBubble(bubble);
            }, false);

            const searchString = 'https://geocoder.ls.hereapi.com/6.2/geocode.json?apiKey=JNIn_O9OQdca51JT5ofoou0WOKdp69bNG-XxHaHqPLo&searchtext='
            const geoLocate = async (address, info) => {

                await axios.get(searchString + address.replace(', ', '+').replace(' ', '+'))
                    .then(function (response) {
                        // handle success
                        const result = response.data.Response.View[0].Result[0].Location.DisplayPosition;
                        const coord = { lat: result.Latitude, lng: result.Longitude }

                        addMarkerToGroup(group, coord, info);
                    })
                    .catch(function (error) {
                        // handle error
                        console.log(error);
                    })
            }

            if (loadData) {
                data.Cost_of_Living.map((item, index) => {
                    geoLocate(item.City, item.Local_Purchasing_Power_Index)
                })
            }
        }

        // Now use the map as required...
        addInfoBubble(map);

        setMap(map)
    }

    const layerChange = async (selected) => {
        switch (selected) {
            case '1':
                await setLayer(defaultLayers.raster.normal.map)
                break
            case '2':
                await setLayer(defaultLayers.raster.normal.transit)
                break
            case '3':
                await setLayer(defaultLayers.raster.normal.mapnight)
                break
            case '4':
                await setLayer(defaultLayers.raster.normal.trafficincidents)
                break
            case '5':
                await setLayer(defaultLayers.raster.normal.xbase)
                break
            case '6':
                await setLayer(defaultLayers.raster.satellite.map)
                break
            case '7':
                await setLayer(defaultLayers.raster.satellite.xbase)
                break
            case '8':
                await setLayer(defaultLayers.raster.terrain.map)
                break
            case '9':
                await setLayer(defaultLayers.raster.terrain.xbase)
                break
            default:
                break
        }

        document.getElementById('refreshButton').click()
    }

    return (
        // Set a height on the map so it will display
        <div id='mapView' style={{ height: '100%' }}>
            <button id='refreshButton' onClick={() => { map.dispose(); getMap() }}
                style={{
                    position: 'fixed', top: '10px', left: '10px', zIndex: 2,
                    border: '2px solid green'
                }}
            >refresh</button>

            <select style={{
                position: 'fixed', top: '10px', left: '80px',
                height: '18px', width: '90px', zIndex: 2, fontSize: '13px'
            }}
                onChange={e => layerChange(e.target.value)}
            >
                <option value="1">default layer</option>
                <option value="2">transit</option>
                <option value="3">night</option>
                <option value="4">accident</option>
                <option value="5">xbase</option>
                <option value="6">satellite</option>
                <option value="7">satellite xbase</option>
                <option value="8">terrain</option>
                <option value="9">terrain xbase</option>
            </select>

            <button style={{ position: 'fixed', top: '10px', right: '10px', zIndex: 2 }}
                onClick={() => {
                    const formStyle = document.getElementById('pageForm').style
                    if (formStyle.display === 'none') {
                        formStyle.position = 'fixed'
                        formStyle.top = '30px'
                        formStyle.right = '10px'
                        formStyle.zIndex = 2
                        formStyle.display = 'block'
                        formStyle.backgroundColor = 'white'
                    }
                    else {
                        formStyle.display = 'none'
                    }
                }}>
                <i class="fa fa-bars"></i></button>

            <PageForm />

            <button style={{
                position: 'fixed', top: '10px', left: '50%', zIndex: 2,
                transform: 'translateX(-50%)', backgroundColor: '#F8C471',
                height: '50px', width: '50px', borderRadius: '25px',
                fontSize: '20px',
            }}
                onClick={() => alert('Local Purchasing Power Index')}
            >Tip</button>

            <div style={{ position: 'fixed', top: '40px', left: '10px', zIndex: 2, fontSize: '12px' }}>
                lowest
                <button style={{ width: '10px', height: '10px', backgroundColor: '#0000FF' }}></button>
                <button style={{ width: '10px', height: '10px', backgroundColor: '#0080FF' }}></button>
                <button style={{ width: '10px', height: '10px', backgroundColor: '#00FFFF' }}></button>
                <button style={{ width: '10px', height: '10px', backgroundColor: '#80FF00' }}></button>
                <button style={{ width: '10px', height: '10px', backgroundColor: '#FFFF00' }}></button>
                <button style={{ width: '10px', height: '10px', backgroundColor: '#FF8000' }}></button>
                <button style={{ width: '10px', height: '10px', backgroundColor: '#FF0000' }}></button>
                highest
            </div>
        </div>
    );

}

-----------------------------------
//data.js

  "Cost_of_Living": [
        {
            "Rank": "1",
            "City": "Zurich, Switzerland",
            "Cost_of_Living_Index": "131.49",
            "Rent_Index": "64.37",
            "Cost_of_Living_Plus_Rent_Index": "98.8",
            "Groceries_Index": "131.23",
            "Restaurant_Price_Index": "120.39",
            "Local_Purchasing_Power_Index": "121.12"
        },
        {
            "Rank": "2",
            "City": "Lugano, Switzerland",
            "Cost_of_Living_Index": "130.75",
            "Rent_Index": "40.2",
            "Cost_of_Living_Plus_Rent_Index": "86.66",
            "Groceries_Index": "134.8",
            "Restaurant_Price_Index": "115.19",
            "Local_Purchasing_Power_Index": "101.15"
        },

--------------------------------
//prepare data
 Index by City 2020 Mid-Year Table from

copy table to Notepad++ -> copy to excel -> convert excel to json @ http://beautifytools.com/excel-to-json-converter.php

reference:

Wednesday 8 July 2020

ionic react here projects


reference:
Route change trigger url change, but doesn't render
https://github.com/ionic-team/ionic-framework/issues/20707

react-router does not work in production and surge deployments


For surge, you can add a 200.html file which contains the same contents as the index.html you're deploying (or just rename it to 200.html) - this will then be served to users at any URL they visit which doesn't correspond to a static file, allowing your app to start running.

looks like you're using create-react-app. This works when you're developing locally because create-react-app's react-scripts package handles serving your index.html as a fallback for these requests.

https://stackoverflow.com/questions/44491184/react-router-does-not-work-in-production-and-surge-deployments

Monday 6 July 2020

ionic react Here elevation

tap to get elevation, Calgary is 1086 m AMSL (above mean sea level) 

Mt Robson is 3850 m AMSL

sea is 0 m AMSL

Mt Everest is 8840 m AMSL
//here10.js

import React, { useState, useEffect } from 'react';
import PageForm from './PageForm'
import axios from 'axios'

export default function Here() {
    const [map, setMap] = useState(null)
    const [layer, setLayer] = useState(null)

    useEffect(() => {
        getMap()
        setTimeout(() => {
            document.getElementById('refreshButton').click()
        }, 1000);
        return () => map.dispose();
    }, []);

    const H = window.H;

    const platform = new H.service.Platform({
        apikey: "JNIn_O9OQdca51JT5ofoou0WOKdp69bNG-XxHaHqPLo"
    });

    const defaultLayers = platform.createDefaultLayers();

    const getMap = () => {
        // Create an instance of the map
        const map = new H.Map(
            document.getElementById('mapView'),
            layer ? layer : defaultLayers.raster.normal.map,
            {
                // This map is centered over Europe
                zoom: 3,
                center: { lat: 51.048615, lng: -114.070847 },
                pixelRatio: window.devicePixelRatio || 1
            }
        );

        // Enable the event system on the map instance:
        const mapEvents = new H.mapevents.MapEvents(map);

        let destinationMarker = null

        // Add tap listeners:
        map.addEventListener('tap', function (evt) {

            const coord = map.screenToGeo(evt.currentPointer.viewportX,
                evt.currentPointer.viewportY);
            console.log(coord.lat, coord.lng)

            //find elevation
            const bingUrl = 'https://dev.virtualearth.net/REST/v1/Elevation/List?points=' +
                coord.lat.toString() + ',' + coord.lng.toString() +
                '&key=AhNPHFdo4aSWZx-zbVfAoRT5V1j8B2OMjvE511qMlEnAzvKNxVy3Yux1f8cd5YPs'

            axios.get(bingUrl)
                .then(function (response) {
                    // handle success
                    const data = response.data.resourceSets[0].resources[0].elevations;
                    console.log(data)
                    document.getElementById('elevation').innerHTML = data[0]

                })
                .catch(function (error) {
                    // handle error
                    console.log(error);
                })

            //remove last destination
            if (destinationMarker) { map.removeObject(destinationMarker) }

            //add a destination marker
            const svgMarkup = '<svg width="24" height="24" ' +
                'xmlns="http://www.w3.org/2000/svg">' +
                '<path d="M26 4v12h-16v12h-4v-24h20z"></path>' +
                '</svg>';

            const icon = new H.map.Icon(svgMarkup)
            destinationMarker = new H.map.Marker(coord, { icon: icon });

            map.addObject(destinationMarker);
        })


        // Instantiate the default behavior, providing the mapEvents object:
        const behavior = new H.mapevents.Behavior(mapEvents);

        setMap(map)
    }

    const layerChange = async (selected) => {
        switch (selected) {
            case '1':
                await setLayer(defaultLayers.raster.normal.map)
                break
            case '2':
                await setLayer(defaultLayers.raster.normal.transit)
                break
            case '3':
                await setLayer(defaultLayers.raster.normal.mapnight)
                break
            case '4':
                await setLayer(defaultLayers.raster.normal.trafficincidents)
                break
            case '5':
                await setLayer(defaultLayers.raster.normal.xbase)
                break
            case '6':
                await setLayer(defaultLayers.raster.satellite.map)
                break
            case '7':
                await setLayer(defaultLayers.raster.satellite.xbase)
                break
            case '8':
                await setLayer(defaultLayers.raster.terrain.map)
                break
            case '9':
                await setLayer(defaultLayers.raster.terrain.xbase)
                break
            default:
                break
        }

        document.getElementById('refreshButton').click()
    }

    return (
        // Set a height on the map so it will display
        <div id='mapView' style={{ height: '100%' }}>
            <button id='refreshButton' onClick={() => { map.dispose(); getMap() }}
                style={{
                    position: 'fixed', top: '10px', left: '10px', zIndex: 2,
                    border: '2px solid green'
                }}
            >refresh</button>

            <select style={{
                position: 'fixed', top: '10px', left: '80px',
                height: '18px', width: '90px', zIndex: 2, fontSize: '13px'
            }}
                onChange={e => layerChange(e.target.value)}
            >
                <option value="1">default layer</option>
                <option value="2">transit</option>
                <option value="3">night</option>
                <option value="4">accident</option>
                <option value="5">xbase</option>
                <option value="6">satellite</option>
                <option value="7">satellite xbase</option>
                <option value="8">terrain</option>
                <option value="9">terrain xbase</option>
            </select>

            <button style={{ position: 'fixed', top: '10px', right: '10px', zIndex: 2 }}
                onClick={() => {
                    const formStyle = document.getElementById('pageForm').style
                    if (formStyle.display === 'none') {
                        formStyle.position = 'fixed'
                        formStyle.top = '30px'
                        formStyle.right = '10px'
                        formStyle.zIndex = 2
                        formStyle.display = 'block'
                        formStyle.backgroundColor = 'white'
                    }
                    else {
                        formStyle.display = 'none'
                    }
                }}>
                <i class="fa fa-bars"></i></button>

            <PageForm />

            <div style={{ position: 'fixed', top: '40px', left: '10px', zIndex: 2, backgroundColor: 'white' }}>
                Elevation: <i style={{ color: 'red' }} id='elevation'></i> m<br />
            </div>
        </div>
    );

}

reference:
bing map get elevations
https://docs.microsoft.com/en-us/bingmaps/rest-services/elevations/get-elevations