
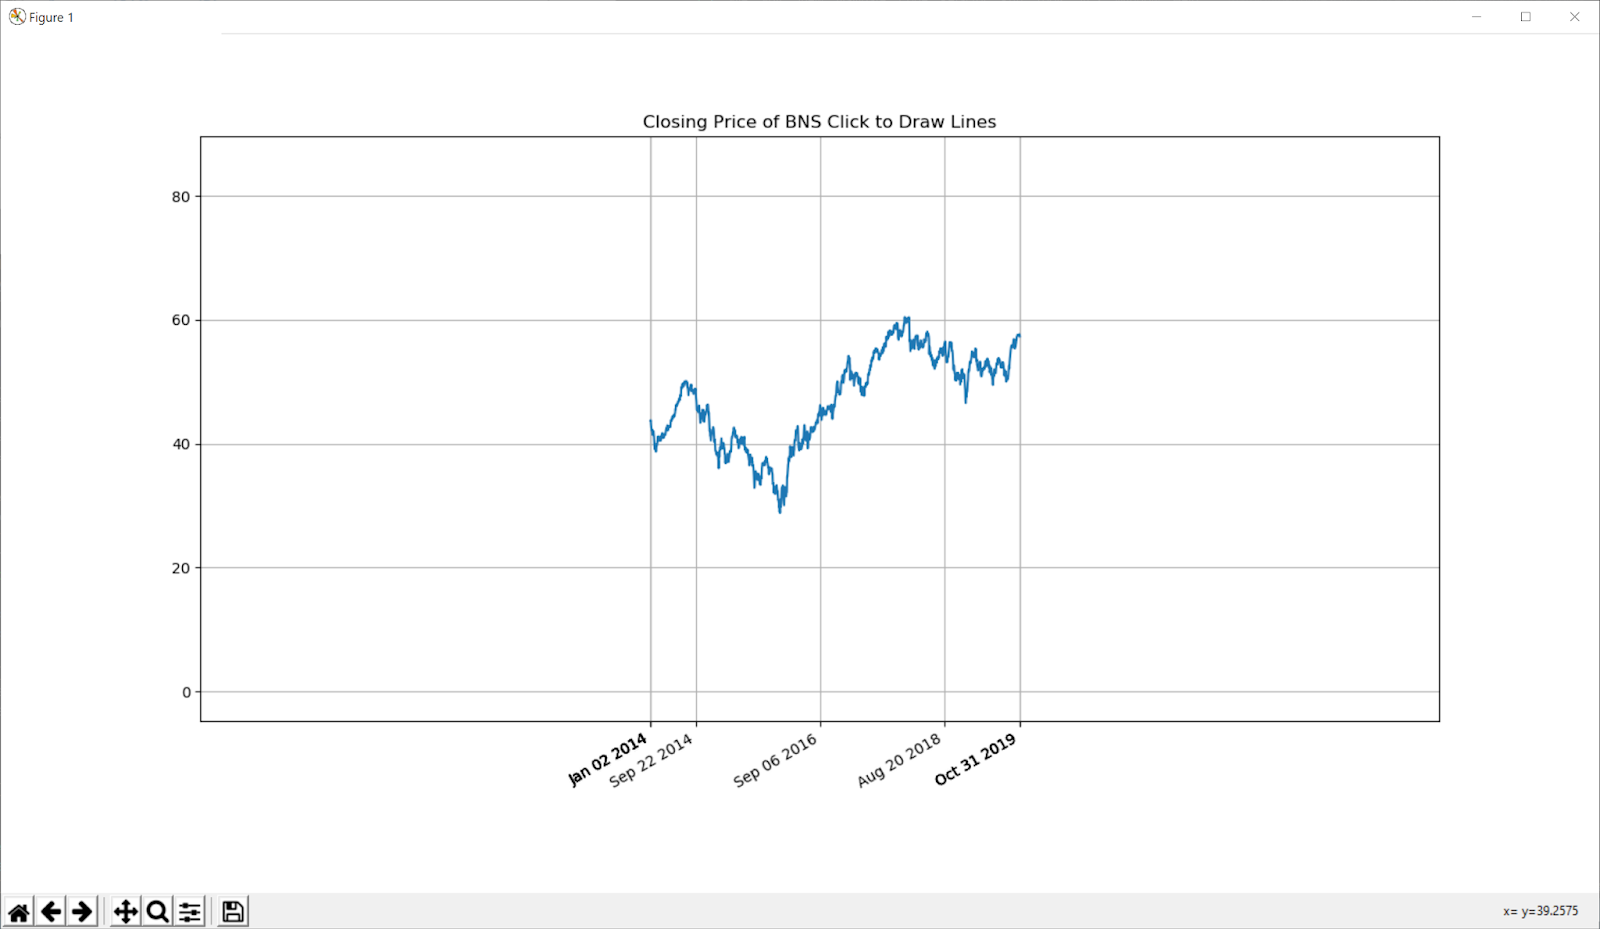
original graph year 2014 - 2019

scroll mouse to zoom in year 2016 - 2019
xaxis date updates with zoom
scroll to zoom out, xaxis is collapsed

zoom in again, xaxis expands again
from matplotlib import pyplot as plt
import numpy as np
import datetime as dt
import pandas_datareader.data as web
class ZoomClass(object):
def __init__(self, base_scale, tick_num, x, y):
self.base_scale = base_scale
self.tick_num = tick_num
self.x = x
self.y = y
def zoom_event(self, event):
if not event.inaxes:
return
# get the current x and y limits
cur_xlim = ax.get_xlim()
cur_ylim = ax.get_ylim()
xdata = event.xdata # get event x location
ydata = event.ydata # get event y location
if event.button == 'up':
# zoom in
scale_factor = self.base_scale
elif event.button == 'down':
# zoom out
scale_factor = 1 / self.base_scale
else:
scale_factor = 1
print(event.button)
# set new boundary, center is mouse position
ax.set_xlim([xdata - (xdata-cur_xlim[0]) / scale_factor, xdata + (cur_xlim[1]-xdata) / scale_factor])
ax.set_ylim([ydata - (ydata-cur_ylim[0]) / scale_factor, ydata + (cur_ylim[1]-ydata) / scale_factor])
# get the current x limits again
cur_xlim = ax.get_xlim()
#update xaxis date range, numbers on axis updates automatically, dates need update manually
xticks = []
for i in range(0, self.tick_num):
value = int(cur_xlim[0]) + int(i * (cur_xlim[1] - cur_xlim[0]) / self.tick_num)
# take care of values beyond x limits
if value < 0:
value = 0
if value > np.max(self.x):
value = np.max(self.x)
xticks.append(value)
print(xticks)
xlabels = [x_format[xticks[i]] for i in range(0, self.tick_num)]
ax.set_xticks(xticks)
ax.set_xticklabels(xlabels)
# refresh plot
fig.canvas.draw()
start = dt.datetime(2014, 1, 1)
end = dt.datetime(2019, 10, 30)
ticker = 'BNS'
df = web.DataReader(ticker, 'yahoo', start, end)
x = df['Adj Close'].index
y = df['Adj Close'].values
#number index is need for the cursor position, xaxis is mapped with integer first and converted to date later
x_num_index = np.arange(0, len(x), 1)
fig, ax = plt.subplots()
plot1 = ax.plot(x_num_index, y)
#get default # of lables on x axis
n = len(ax.get_xticklabels())
print(n)
zoom_view = ZoomClass(1.2, n, x_num_index, y)
fig.canvas.mpl_connect('scroll_event', zoom_view.zoom_event)
x_format = x.strftime('%b %d %Y')
xticks = [int(i*len(x)/n) for i in range(0, n)]
xlabels = [x_format[int(i*len(x)/n)] for i in range(0, n)]
ax.set_xticks(xticks)
ax.set_xticklabels(xlabels)
ax.set_ylim([np.min(y), np.max(y)])
ax.set_title('Closing Price of %s Click to Draw Lines' %(ticker))
plt.gcf().autofmt_xdate()
plt.grid(True)
plt.show()
---------------------------------
#logs
up
[14, 148, 283, 417, 552, 686, 821, 955, 1090, 1225]
down
[0, 88, 250, 411, 573, 734, 896, 1057, 1219, 1380]
down
[0, 56, 250, 444, 638, 832, 1025, 1219, 1413, 1468]
up
[0, 154, 316, 477, 639, 800, 962, 1123, 1285, 1446]
up
[157, 291, 426, 560, 695, 830, 964, 1099, 1233, 1368]
up
[264, 376, 488, 600, 712, 824, 937, 1049, 1161, 1273]
up
[353, 446, 540, 633, 727, 820, 914, 1007, 1101, 1194]
up
[427, 505, 583, 661, 739, 817, 895, 973, 1051, 1129]
down
[324, 417, 511, 605, 698, 792, 886, 980, 1073, 1167]
down
[201, 313, 426, 538, 651, 763, 876, 989, 1101, 1214]
down
[53, 188, 323, 458, 593, 728, 863, 998, 1134, 1269]
up
[200, 312, 425, 538, 650, 763, 876, 988, 1101, 1214]
down
[26, 161, 296, 431, 567, 702, 837, 972, 1108, 1243]
...
up
[545, 639, 734, 828, 923, 1018, 1112, 1207, 1301, 1396]
up
[613, 691, 770, 849, 928, 1007, 1086, 1165, 1244, 1323]
up
[670, 735, 801, 867, 933, 999, 1065, 1130, 1196, 1262]
down
[612, 691, 770, 849, 928, 1007, 1086, 1165, 1244, 1323]
down
[542, 636, 731, 826, 921, 1016, 1111, 1206, 1301, 1396]
down
[500, 614, 728, 842, 956, 1070, 1184, 1298, 1412, 1468]
up
[573, 668, 763, 858, 953, 1048, 1143, 1238, 1333, 1428]
up
[637, 716, 795, 874, 953, 1033, 1112, 1191, 1270, 1349]
down
[572, 667, 762, 857, 952, 1047, 1142, 1238, 1333, 1428]
up
[666, 745, 824, 903, 983, 1062, 1141, 1221, 1300, 1379]
down
[566, 661, 756, 851, 947, 1042, 1137, 1232, 1328, 1423]
down
[446, 560, 674, 789, 903, 1018, 1132, 1246, 1361, 1468]
down
[286, 423, 560, 698, 835, 973, 1110, 1247, 1385, 1468]
down
[94, 258, 423, 588, 753, 918, 1083, 1248, 1413, 1468]
down
[0, 61, 259, 457, 655, 853, 1051, 1249, 1447, 1468]
down
[0, 0, 62, 300, 537, 775, 1012, 1250, 1468, 1468]
down
[0, 0, 0, 192, 477, 762, 1047, 1332, 1468, 1468]
down
[0, 0, 0, 60, 402, 744, 1086, 1428, 1468, 1468]
down
[0, 0, 0, 0, 312, 722, 1133, 1468, 1468, 1468]
down
[0, 0, 0, 0, 181, 674, 1166, 1468, 1468, 1468]
up
[0, 0, 0, 0, 289, 699, 1110, 1468, 1468, 1468]
up
[0, 0, 0, 35, 377, 719, 1061, 1403, 1468, 1468]
up
[0, 0, 0, 166, 451, 736, 1021, 1306, 1468, 1468]
up
[0, 0, 37, 275, 512, 750, 987, 1225, 1462, 1468]
up
[0, 0, 168, 366, 564, 762, 960, 1158, 1356, 1468]
up
[0, 97, 262, 427, 592, 757, 922, 1087, 1252, 1417]
down
[0, 0, 154, 352, 550, 748, 946, 1144, 1342, 1468]
up
[0, 84, 249, 414, 579, 744, 909, 1074, 1239, 1404]
reference:
https://stackoverflow.com/questions/11551049/matplotlib-plot-zooming-with-scroll-wheel
https://stackoverflow.com/questions/26131607/matplotlib-get-ylim-values
https://matplotlib.org/3.1.1/gallery/showcase/integral.html#sphx-glr-gallery-showcase-integral-py
No comments:
Post a Comment